More Charts in the Django Admin
Posted on Mon 09 November 2020 in Posts
So in my day job I do a decent amount of work in Django, and have recently been getting into customizing the Django admin page. If you've never done much with the Django admin, the docs are definitely worth checking out, and once you've gone through that the Django Admin Cookbook is also an excellent resource for tips on ways to get even more out of the Django admin site. Having said that, I wanted to get some pretty graphs like all the cool kids in Javascript-land are doing.
I stumbled across this awesome blog
post by Dani Hodovic
that is a great example of how to use Chart.js to
throw a basic bar chart into the Django admin. There's one problem though: the
chart doesn't respect any filters you have in the Django admin, instead only
graphing the entire dataset. What I want is if you (as an example) had a
date_hierarchy set up on your ModelAdmin, then as you pick date filters the
graph re-renders to only graph the filtered data. Lets see how we might do
that. As a starting point, I'm going with the code from that blog post, which
is on Github at: https://github.com/danihodovic/django_admin_chart_js, specifically
I'm going to be working from the current master which (at the time of writing)
is SHA d8fc3a68ad68f3bea139b0a4c888f006ef97c286.
Setting Up the Filter
First off, we need some filters on the EmailSubscribers model, so lets add
that:
class EmailSubscriberAdmin(admin.ModelAdmin):
    date_hierarchy = "created_at"

    ... rest of the code as it exists ...
If you've never done anything with the Django admin before, this might seem like magic, 1-line to get a nice date filter in place:
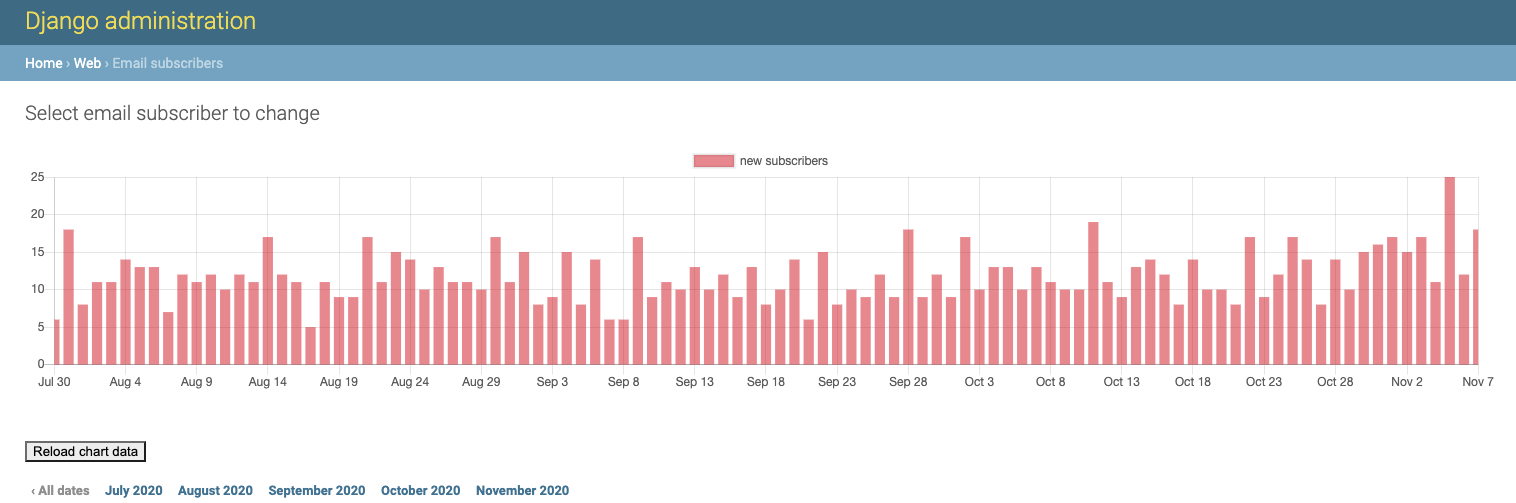
As you click those filters, the changeset view will adjust to only those records which meet that criteria. All this for 1-line of code. Yup, Django's pretty sweet.
Getting the Filters
So first problem with adjusting the graph to only those rows that are selected
is to figure out how to get what filters are currently in place. As it turns
out, you can get this from the result of the changelist_view() function in
your ModelAdmin via the context_data mapping:
def changelist_view(self, request, extra_context=None):
    response = super().changelist_view(request, extra_context=extra_context)
    queryset = response.context_data["cl"].queryset
At this point queryset is a regular Django QuerySet object with the filters
that have been applied in the current changelist view. This is exactly what we
need, as the chart_data function from original blog post just does a few
transformations (annotations) on a QuerySet object that was just all
EmailSubscriber objects. The original function looked like:
def chart_data(self):
    return (
        EmailSubscriber.objects.annotate(date=TruncDay("created_at"))
        .values("date")
        .annotate(y=Count("id"))
        .order_by("-date")
    )
So if we replace EmailSubscriber.objects with the queryset, we get exactly
what we want:
@admin.register(EmailSubscriber)
class EmailSubscriberAdmin(admin.ModelAdmin):
    ... code omitted for brevity ...

    def changelist_view(self, request, extra_content=None):
        response = super().changelist_view(request, extra_context=extra_context)
        queryset = response.context_data["cl"].queryset
        chart_data = self.chart_data(queryset)
        as_json = json.dumps(list(chart_data), cls=DjangoJSONEncoder)
        response.context_data.update({"chart_data": as_json})
        return response

    ... other functions unchanged ...

    def chart_data(self, queryset):
        return (
            queryset.annotate(date=TruncDay("created_at"))
            .values("date")
            .annotate(y=Count("id"))
            .order_by("-date")
        )
And bingo, now as we click some of the date hierarchy filters the graph re-renders with only the selected rows:
A Wrinkle
One problem: the "Reload Chart data" button now breaks, because it's still
trying to call chart_data() without supplying a QuerySet object. That's an
easy fix though, just modify the chart_data_endpoint() function to call
chart_data() with the same QuerySet the function used to use inside it --
EmailSubscriber.objects:
    def chart_data_endpoint(self, request):
        chart_data = self.chart_data(EmailSubscriber.objects)
        return JsonResponse(list(chart_data), safe=False)
Now clicking "Reload Chart data" reverts the graph back to showing all records, leaving the filters in place.